A palimpsest of philanthropy
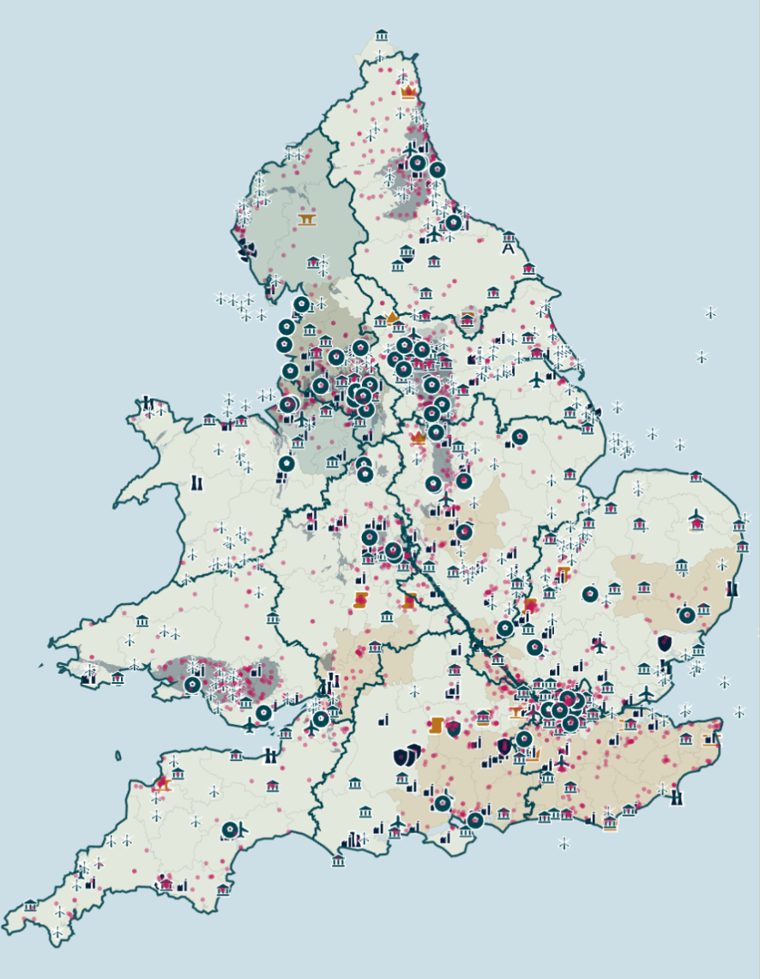
Lay every layer on top of the others and England and Wales become a map written over many times: medieval charters, coal seams, dockyards, power networks, runways. Turn the layers on and off.
Where the money went
Money to the charities near each place, or inside each line, from 2020-21 to 2025-26. The bar is on a log scale, so each step to the right is ten times the money. Click a row to go back to its map.
How we worked it out
Every charity in England and Wales that got a grant we could find between 2020-21 and 2025-26 is a dot, placed at the postcode on the Charity Commission register: charities.
For each kind of place, we counted how many of a funder's charities are within a set distance of one. We compared that with charities like them: in the same region, and in places just as busy, so a funder that likes town centres doesn't look as if it follows shops or prisons.
Small numbers are pulled towards "no different" until the evidence is strong. We tested each funder against the thing it is set up around: airport funds against airports, quarry companies against quarries. Funders that give in one town are left out, because they are near whatever that town has.
For a boundary, such as the Duchy of Lancaster's counties or an electricity network's licence area, we compare the share of a funder's charities inside it with the share of all charities there.
A charity sits at its registered postcode, which is not always where it works. A national charity running a project in a town counts as wherever its head office is, so these results, if anything, understate the patterns.
Close by is not the same as caused by. These are patterns in where grants went. The reasons given are what each funder is set up to do, from its own published documents.
Sources
- Grants: charity accounts and 360Giving, from Plinth's UK funding data. Each grant is counted once.
- Charity postcodes and what each charity says it does: Charity Commission register, Open Government Licence.
- Coal-bearing rock: British Geological Survey 1:625,000 bedrock map, Open Government Licence. Contains British Geological Survey materials © UKRI. It shows coal where it reaches the surface, so deep coalfields such as Kent and Selby are missing.
- Wind farms, landfill gas and waste-burning sites: DESNZ Renewable Energy Planning Database, July 2026, Open Government Licence. Power stations: DESNZ DUKES 5.11.
- Airports: OurAirports, public domain. Nuclear sites, estates, bases, power stations, football grounds and the Woodsmith mine: Wikidata, CC0.
- Electricity network licence areas: National Energy System Operator, NESO Open Data Licence.
- Council areas: Office for National Statistics, Open Government Licence.
- The HS2 route, John Lyon's roads and building society branches: © OpenStreetMap contributors, Open Database Licence.
- Pictures: Wikimedia Commons, each credited with its licence beneath it.